


Academics from the School of Geography and Environment launched a survey of the staff and students at an Oxford college this week as part of the most extensive study of flying practices at the University.
The survey states that the study aims “to investigate flying practices by academics, students and professional staff at a single Oxford college, in order to gain insights into the motivations, necessity and potential for reducing travel by aviation.” As part of ethical considerations and agreements with the college, the researchers have asked that the college remain anonymous at this stage.
The results of the study will be used to inform the University’s FlyingLess Policy and to provide data for use by the Environmental Sustainability Team. Dr Debbie Hopkins, the Associate Professor in Human Geography leading the study, said that, “there has been remarkably little empirical research into the issue,” to date, and that most research so far has focused solely on academics, “but has largely excluded student’s travel and that of university administrative and professional staff.”
Data from Oxford’s Environmental Sustainability website shows that in 2018-19, at least 30,000 tonnes of carbon were emitted by staff flying on University business alone, which is equivalent to roughly half the CO2 emitted annually from University buildings. This figure does not include flights taken by international students or those attending seminars, conferences or other courses at Oxford.
Dr Hopkins added, “My perspective is that we cannot make suitable recommendations which avoid exacerbating existing inequalities and which account for the diversity of mobility practices across the university, without better understanding the way people travel currently.”
“Understanding how people conceptualise ‘necessity’ in travel behaviour,” is key to reducing volumes of flying, Hopkins said. She remarked that previous research with colleagues “showed a large proportion of travel is not viewed to be particularly important – so this is where we can try to start reducing volumes of flying.”
Another difficulty is in deciding who is responsible for emissions from flights to and from Oxford, with Hopkins suggesting that, “there are some issues on which flights are accounted for by the university and which are not.” Deciding whether University-related flying should be counted as scope 1, 2 or 3 emissions will impact the extent and urgency with which these emissions are tackled. Whilst scopes 1 and 2 focus on more direct forms of an organisation’s emissions, such as direct energy usage on site, it is often scope 3 emissions that amount to the greatest share of an organisation’s footprint, including business travel.
Oxford University announced plans for an Environmental Sustainability Strategy in September 2019, with the aim of reaching a net gain in biodiversity and net zero carbon across all activities by 2050, aspiring to achieve these goals earlier if possible. Alongside travel, areas for proposed action include energy, sustainable food and resource use, investment and biodiversity.
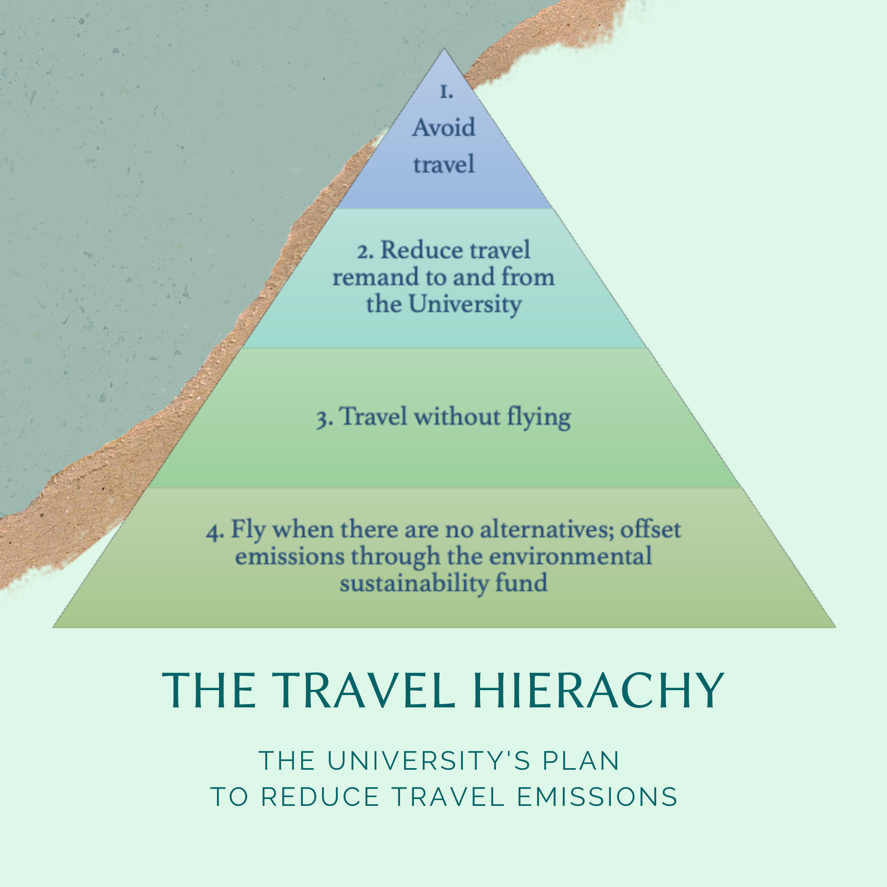
The University needs to substantially reduce travel emissions if it is to reach its net zero targets, and thus, is encouraging staff and students to follow a so-called ‘travel hierarchy’. The hierarchy ranks four actions staff and students can take to reduce their emissions from travel: 1) avoid travel; 2) reduce travel remand to and from the University; 3) travel without flying; and 4) fly when there are no alternatives and offset these emissions through the environmental sustainability fund.

Other measures considered by the Environmental Sustainability Strategy Working Group include: providing accommodation for international students during vacations to reduce travel demand; improving technology within departments to encourage remote working; placing a charge on all flights to contribute to an offsetting scheme; and working with Russell Group Universities to create a market for permanent geological carbon offsetting.
The project will end in October, with the survey closing in mid-August, followed by interviews with students and staff at the college until mid-September.
Infographic created by Ipsita Sarkar.